Quick demo / test procedure for ProfiHub B5+RD
Basic Quick Demo (in course of update!)
The following procedure will get your ProfiHub B5+R(D) up and running as a PROFIBUS DP slave, showing details of front panel terminator switch changes via ProfiTrace Live List Info Panel with Extended Diagnostics. We include saving set-up details for later.
It is assumed that very similar procedure, using different GSD files, may be used with the other new (2019) diagnostic versions of the B2+R, B2FO2, B4FO2 and D1 repeaters, but have not so far been tested here!
The intention of this demo is simply to get you using the kit, opening windows for further research and trials in order to eventually understand everything that it does! With practise, everything in this procedure can be completed in about 3 minutes!
You will need : –
• B5+R(D) Diagnostic Repeater
• Source of 24 volt DC power, with (at least one) connector onto your B5+R(D)
• A computer with ProfiTrace & ProfiCaptain software installed and tested, with…
• Associated (licensed) ProfiCore Ultra, USB lead and Tap Lead
• The B5+R(D) GSD (and bit map graphic) files (available as downloads from www.procentec.com)
• An instrument screwdriver with 2 to 2.5 mm straight blade
Trial Procedure : –
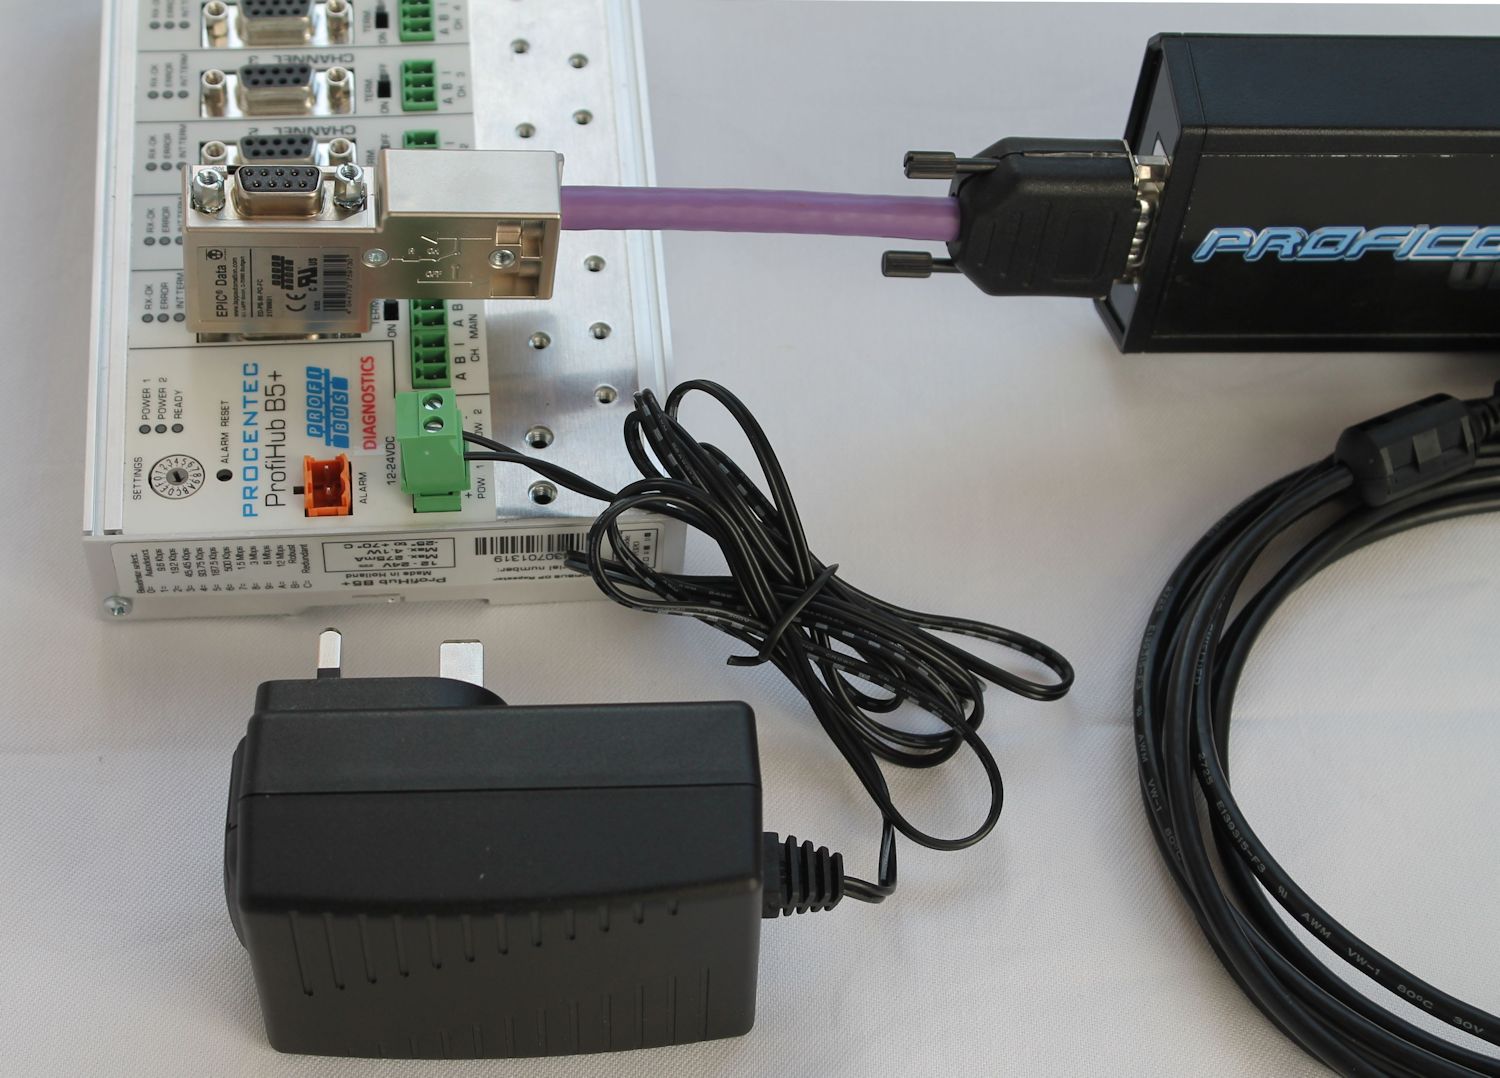
1 Connect ProfiCore Ultra to Main Channel 9-pin connector on B5+R(D) using Tap Lead. Connect other side of ProfiCore Ultra to your computer USB port, as in photo.
2 Leaving B5+RD top left corner ‘SETTINGS’ dial at default ‘0’ position, and all terminator switches in the OFF position, connect 24 DC power to the unit. After start-up sequence, confirm that LED indicators light on the B5+R(D) unit, with green Ready indicator flashing and Power 1 and/or Power 2 also shown, as appropriate. All channel status indicators should show associated channel errors with red LEDs illuminated.
3 At your computer, start your ProfiTrace program (click on top left Init.ProfiCore Ultra button) and when display shows error message ‘Unable to autodetect baudrate’, click OK and await completion of start-up sequence. Confirm both green and amber LED indicators shown alongside USB connector on end of ProfiCore Ultra adapter.
4 In ProfiTrace Program, click top of screen ProfiCaptain tab. Then double click on mid-screen ProfiCore Ultra image, then on the Stop button shown in following ‘Master system configuration’ dialogue to start the ProfiCaptain program scanning for any connected PROFIBUS slaves.
Click top of screen ProfiTrace tab, and confirm that in the displayed Live List you can see your ProfiCaptain Master shown as a red number 1 (at address location 1), but with no other returns in that array.
If not seen previously, select the top of screen Bar graph tab, noting display of single green bar (for device at address 1, with that number shown below the bar) for your ProfiCore Ultra driver voltage, with typical value of about 7.6 volts. Select top of screen Oscilloscope tab, then double click on lower screen red number 1 to synchronise to the displayed waveform coming from the device at address 1 (your ProfiCore Ultra). This procedure offers a very quick self-test of your ProfiCore Ultra adapter and ProfiTrace software also confirming here that the B5+ is not then operating as a slave.
At the B5+R(D), confirm that top RX-OK LED indicator for Main Channel is flashing and that the previously flashing Ready indicator is now on and steady.
5 At the B5+R(D), remove the power supply connector(s) to turn that device off. Using screwdriver, change the rotary switch setting to the B position. Re-connect the 24 volt power supply to the unit, noting once again correct flashing of the Main Channel top green LED indicator, after completion of the start-up sequence.
At your computer, confirm that the ProfiTrace Live List display now shows a new device, normally at address 126 at bottom of screen, with blue numbers on a white background. This is the typical report for an on-line slave which is not in data exchange.
6 Click on top of screen ProfiCaptain tab, then on the Class 2 Commands button, then the Set/Change Slave Address tab within the offered Class commands dialog window. Note the Current Address shown as 126, then set the required New Address to 12 or some other value which does not conflict with the Master (or any other detected device) – importantly, do not check the Lock Address tick box! When ready, click on the Change Address button, returning to the ProfiTrace Live List page on completion.
Confirm that the B5+R(D) is now shown active at new address location (as blue text on white background), and that the old address location is now shown with yellow background, for ‘lost device’.
Note that after such a slave address change, the B5+R(D) or any other slave will be shown either with an identifier code such as ID=6970 (for the B5+R(D)) or with a device description such as ProfiHub-B5+ Diagnostics. If an ID code is shown, then this either means that the corresponding GSD descriptor file is not available within that computer, or that it has not yet been Scanned into the GSD library for that copy of the ProfiTrace program.
If needed copy the B5+R(D) GSD file into the GSD folder for the required copy of the ProfiTrace program. For example into C:/Program Files/ProfiTrace_V2_9_2/GSD. Next select top of screen Settings heading, then clicking on Scan GSD Library to catalogue all available GSD files. Note that very similar procedure will also be needed under the ProfiCaptain tab, there clicking on Settings followed by Generate Catalogue to scan all GSD files.
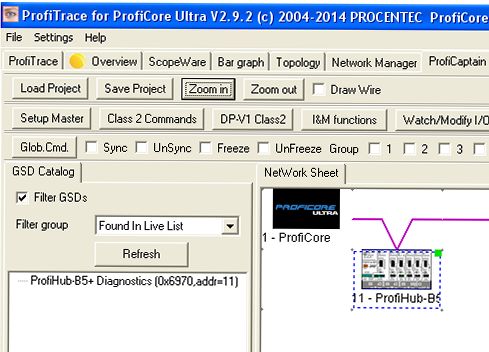
7 Returning to the ProfiCaptain page, click on the left hand Filter GSD box, then select the Found in Live List option line in the offered Filter Group list. This should then show listing only of the single ProfiHub B5+ Diagnostics (0x6970, addr=12) or similar line in the following GSD Catalogue window.
Highlight this with your mouse and, with the left mouse button held down, drag the GSD line into the right hand Network Sheet, releasing the mouse button when the associated device indication is just below and to the right of the displayed ProfiCore Ultra.
8 Now double click on right hand B5+ slave image, setting slave address to 12, or whatever other value has been previously arrange, then click on the Setup Module & Parameters button in order to see available options. In lower Available Modules window, double click on top INFO DATA MANDATROY ON 1st SLOT line, confirming that this then appears in above Selected Modules window. Click OK, then click on Active, before completing set-up with click on lower OK button.
9 Back on the ProfiCaptain Network Sheet, note how the previously black top right corner marker for this slave now changes to blue colour. At this point double click on the black ProfiCore Ultra image, then click on the lower Operate button to bring your B5+R(D) device into full data exchange, with previously mentioned blue corner marker now changing to green, as in following screen image.
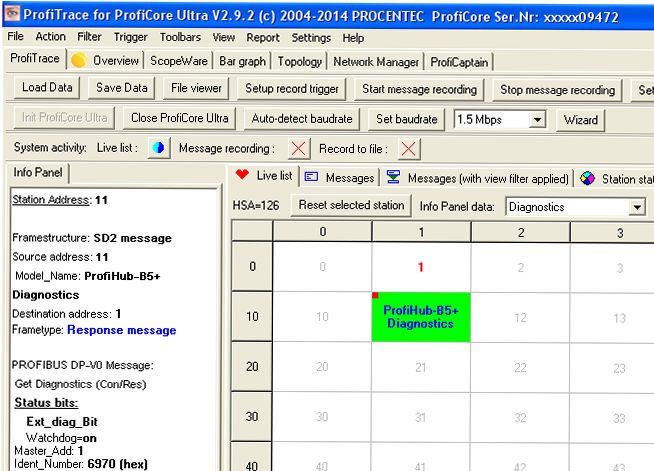
10 Returning to the ProfiTrace Live List display, this device should also now show as ProfiHub-B5+ Diagnostic text on a green background, so confirming device in full data exchange. (much as in final screen image below, after para. 14)
11 Click on this green tile in the Live List, noting associated information about the device now listed down the left hand Info Panel. Change the setting of one or more terminator switches on the front of the B5+R(D) unit, then clicking on the associated ProfiTrace Live List tile, noting how the new settings are reported in the left Info Panel after each change. The Info Panel results are only updated each time you click on a Live List tile and are not automatically updated at each status change at the slave.
12 Returning to the ProfiCaptain page, double click on the B5+ Slave image in the Network Sheet, then on the Setup Module & Parameters button. Now select the User Parameters tab, scrolling right down to near the final line, marked with offset value 9 and Uint8 – Diag change timeout (x100 msec). In right hand panel, change default value of 10 to 255, then clicking on the New Value and Apply Value buttons to activate.
13 Scroll back up this list to the line shown with offset 5 and Datatype Bit 4 – Ext. Diag. on Termination change. Using right hand panel, change the default Disable status to Enable status, then Apply, thereafter returning to the ProfiCaptain Network Sheet with clicks on two OK buttons, noting as program returns that the new setup values are automatically activated without further clicks.
14 Return to the ProfiTrace Live List, noting that if one then changes setting of any B5+R(D) terminator switch(s), you will see change of status of the associated channel amber LED indicator on the slave and see flashing red markers appear on the green B5+ tiles in your ProfiTrace Live List display, indicating triggering of Extended Diagnostic reports from the device. Note also that these red flashes continue for 25 seconds. See following screen image for associated ProfiTrace Live List indication when Extended Diagnostics are being triggered.
15 Finally, return to the ProfiCaptain page and click on the left hand Save Project button to save your set-up for when you next run ProfiCaptain, allowing even quicker demonstration of the above red flash etc when the status of a terminator switch is changed. Projects such as this will be saved in the ProfiTrace/inspect_files folder and should be named appropriately (eg ProfiHub B5+RD Demo – Nov 2021.ppf).
16 In order to see how change data is transferred to ProfiTrace, click on the Messages (With view filter applied) tab, click on the Stick to Bottom box, then on the mid-screen Set view filter button. On the displayed dialogue window, select DP & DB-V1 tab, un-tick the Any DP function box, then click on the top Get diagnostic box, then lower OK button. Click on the Start message recording button and, at the B5+R(D) unit, change the settings of one or more Terminator switches, noting associated pairs of Get Configuration record lines in the message window at each switch change.
This completes our basic B5+R(D) demonstration sequence, which may be extended in many ways. For example, maybe add an additional slave to one of the outgoing channels, then set-up the B5+ to report failures of such a device. One may also use ProfiTrace Message Recording to see further details of reports from the device. One may also connect an indicator to the Alarm relay output connector to show changes to such reports, either using the recessed front panel Alarm Reset button to clear settings or possibly using the ProfiCaptain Watch I/O facilities to apply regular clear down messages.
Suggestions and comments please to :-
Richard Needham
Hi-Port Controls
UK office phone (+44) 2392 552855
UK mobile phone (+44) 7739 847277