ProfiTrace PROFIBUS Analyser
 Procentec ProfiTrace 2 is the most powerful analyzer for PROFIBUS networks. The very latest generation in bus monitoring technology, combining all primary tools :
- Busmonitor
- Oscilloscope
- Bar graph
- Topology Scan
- Reporting
- DP Master
- OPC Server
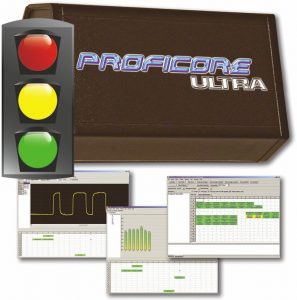
Technicians can check and troubleshoot a complete PROFIBUS network with 1 software package on their laptop PC and 1 piece of extra hardware – an enormous reduction in equipment weight, costs and required knowledge. The advanced USB hardware (ProfiCore™ Ultra) is internally equipped with a high-speed digital oscilloscope and able to capture bus signals running at 12 Mbps.
ProfiTrace is an essential tool for maintenance, commissioning and troubleshooting as well as product development. Typical failures such as noise, reflections, voltage drops, termination problems, double addresses, wire breaks and configuration faults are easily identified.
Random errors such as overshoots, error telegrams, repeats and diagnostics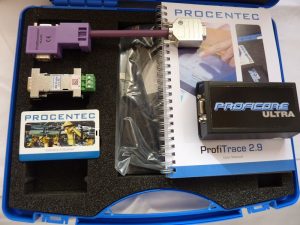 can also be captured and logged. The results can be exported to detailed reports which are accepted by the industry. Predictive maintenance and asset management are really possible with ProfiTrace! This outstanding tool that fits in your pocket, will boost the capabilities of service, maintenance and engineering technicians.
Not only can Hi-Port supply these super kits, but we can also help you to install, set-up and get started, with our comprehensive ProfiTrace User Training Courses – the fastest and easiest way of getting your new ProfiTrace kit up and running for ongoing fault-finding and maintenance checks!
Please note that you can now run your ProfiCore/ProfiTrace from the new Procentec Mercury Industrial Tablet – with up to 2.5 hours operation from the internal Mercury battery. This allows one platform to be used for both PROFIBUS and PROFINET commissioning and diagnostic work!
| ProfiTrace product features |
| Busmonitor for DP and PA with powerful statistics Repeats, fall-outs, corrupted messages, diagnostics, cycle time, etc. |
|
| High-speed digital oscilloscope – ScopeWare Differential voltage, A-line, B-line, noise, overshoots, reflections, triggers. |
|
| Bar graph Average, Min. and Max. values of the bus signals per device. |
|
| Topology Scan Automatic generation of the network topology. |
|
| Reporting Automatic generation of detailed reports that are accepted by the industry. |
|
| DP master – ProfiCaptain A complete DP master has been integrated (V0 and V1). |
|
| ProfiCore Ultra USB interface Useable on PC platforms, no power supply required and elimination of spur lines. |
|
| OPC server and CommDTM | |
| XP, Vista, Windows 7 and Windows 8 platforms | |
| Multi language user interface | |
| Application areas |
| Troubleshooting & maintenance of PROFIBUS networks (ProfiTrace, ScopeWare, Topology scan and ProfiCaptain) |
|
| Commissioning of PROFIBUS networks (ProfiTrace, ScopeWare, Topology scan and ProfiCaptain) |
|
| PROFIBUS product testing and verification (ProfiTrace, ScopeWare, ProfiCaptain and CommDTM) |
|
| Passive cable testing (ScopeWare and ProfiCaptain) |
|
| I/O testing of PROFIBUS devices (ProfiCaptain) |
|
| Setting up and diagnose PROFIBUS devices (CommDTM) |
|
| Address setting of PROFIBUS devices (ProfiCaptain) |
|
| Interface for bus statistics and device I/O to external apps (OPC server) |
|
| Education | |
| Live List |
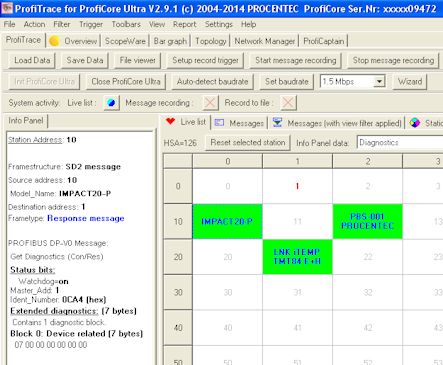 |
“Colours make it easy…..”
The Live List is a matrix that continuously lists all the available devices. It is directly visible which devices are ‘troublemakers’. |
| Statistics matrix |
| “Click and go…..”
The statistics matrix is the most powerful feature of the analyzer. This field can really indicate what the condition of the installation is. It displays all the important information that a user, especially a maintenance technician is really interested in; Because of this feature, the user does not have to inspect messages or do difficult operations to ensure the quality of the installation. If the statistics do NOT show deviations, the installation is essentially OK!!! |
| Message recording |
| “The absolute truth…..” When the user records messages, he has a perfect visual representation on the screen; • Visualization of FDL, DP, DP-V1, DP-V2, PA and I&M messages • Optional event triggered recording options |
 |
| ScopeWare (DP) |
 |
“The easiest oscilloscope ever…..” With the built in oscilloscope we can detect; noise, reflections, termination problems, etc. 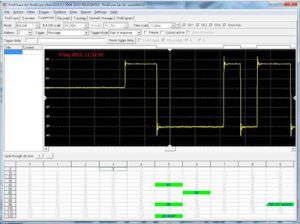
• Time scale: 50 ns to 500 ms |
| ScopeWare (PA) |
 |
• All features of ScopeWare DP • Max. 33 V DC • Max. 1.2 V AC • AC and DC can be displayed simultaneously • Detects missing termination • PA Probe Ultra required |
| Bar graph |
 |
The bar graph is a helpful utility to get an impression of the overall signal quality of the network.
• Shows driver voltages for all connected devices |
| Topology scan |
• Automatic generation of the network topology |
 |
| Reporting |
| “We have proof…..”
The reporting feature creates a detailed report that contains the signals of all devices, their faults, the network topology, bar graph and administrative information. • Generation of detailed network reports Click here for a report example. (omitting later waveforms) |
 |
| DP Master |
| “Test and control your devices…..” • Complete integration of ProfiCaptain • Putting slaves in Data Exchange • I/O control with automatic patterns • Automatic detection of existing busparameters • Brand new concept of ‘stealing’ slaves • Class 2 functions in a Class 1 framework • No shutdowns when updating the configuration • Deactivating slaves in the configuration • Ideal for commissioning new networks • See all connected devices, without PLC • Verify cabling, slave addresses & terminators • Allocate network addresses to software settable slaves • Set PA slave addresses using ComBricks PA Link Module |
 |
| ProfiCore™ Ultra |
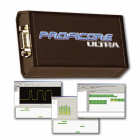 PROFIBUS PROFIBUS• 12 Mbps (all baudrates) • Galvanic isolated PROFIBUS interface • Latest RS 485 technology Oscilloscope Others |
|
|
Description | |
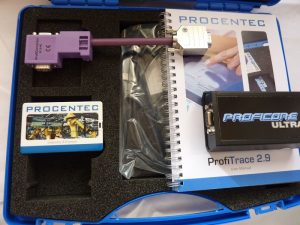
Trouble shooting Toolkit Ultra Plus |
37021 |
• ProfiCore Ultra • USB cable • Tap Connector • Blue carrying case • ProfiTrace 2 |
|
|
Trouble shooting Toolkit
|
38022 | • ProfiCore Ultra • USB cable • Tap Connector • Blue carrying case • ProfiTrace 2 • PA Probe Ultra
|
|
DB9 – M12 Tap Connector |
101-00052B | Allows ProfiCore Ultra
connection onto M12 cables |
|
DP9 Tap Connector |
13020 | Short test cable for
linking ProfiCore Ultra to test point on your PROFIBUS network. Included in both Plus and Pro Kits |
|

PA Probe Ultra |
14020 | Allows ScopeWare
inspection and measurement of PA segment voltages and waveforms. Included in Pro Kit |
|
CommDTM Software |
101-00241A | Enables FDT access
to slave devices using FieldCare, PACTware or similar software |
|
OPC Server |
101-00231B | Included in Pro Kits | |
ProfiCaptain |
22020 | Allows ProfiCore Ultra to run as primary or secondary Master driving PROFIBUS network. Included in Pro kits |
|
Downloads & Links
Current ProfiTrace User Manual
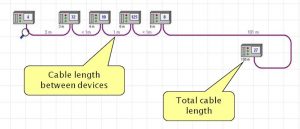
Cable Length Measurement using ProfiTrace
Commission New Networks using ProfiTrace
Click here for a Report example. (omitting later waveforms)